Let’s draw the graph on the graph paper of the following dataand see whether it is liner graph.
Let 1 pencil=length of a side of the smallest squares along x-axis, i.e., x-axis represents the number of pencil.
And 1 rupee = length of a side of the smallest square along y-axis i.e., y-axis represent the price of the pencil
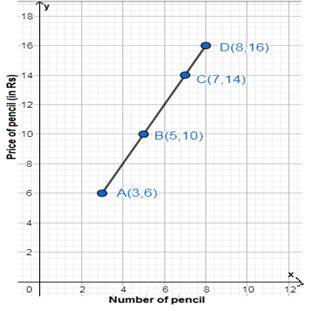
The points of the graph can be represented as shown above. They lie on a line.
A graph in which we obtain a line on joining all the points is called a liner graph. Hence the graph obtained from the data given is a liner graph.
1