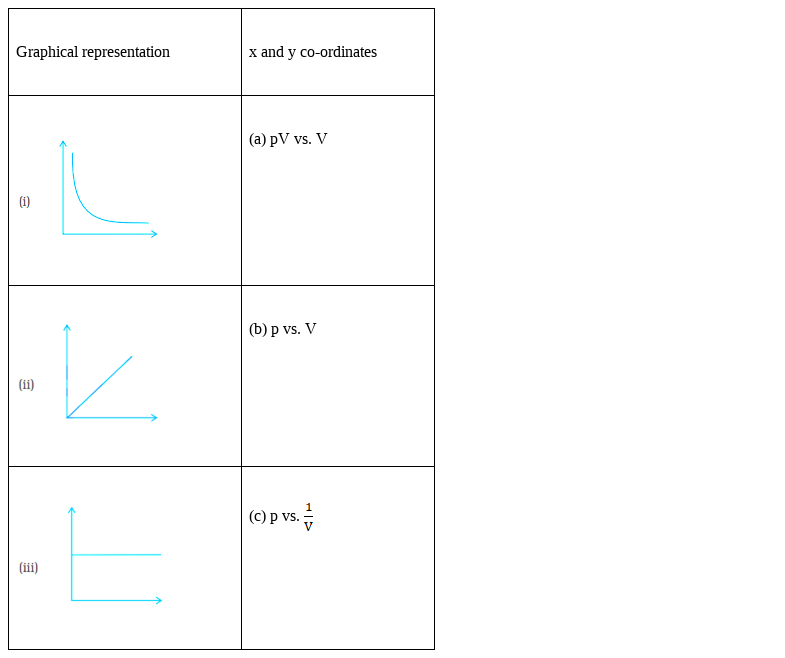
Match the following graphs of ideal gas with their co-ordinates:
(i) – (b)
(ii) – (c)
(iii) – (a)
Plot (i) shows the plot of p vs V, which is nothing but the Boyle’s law plot,
As according to the Boyle’s law:
p1V1 = p2V2 = constant
if we plot the p vs V graph, we observe that the V increase exponentially with the decrease in the pressure.
Plot (ii) again shows the plot of p vs ![]() , which is representing the Boyle’s law plot,
, which is representing the Boyle’s law plot,
As according to the Boyle’s law:
p vs. ![]()
Which means if p increases, ![]() also increases, and vice versa.
also increases, and vice versa.
Hence, straight line passing through origin is formed.
1