Draw a graph from the following data. Draw tangents at x = 2, 4, 6 and 8. Find the slopes of these tangents. Verify that the curve drawn is y = 2x2 and the slope of tangent is ![]()
x 1 2 3 4 5 6 7 8 9 10
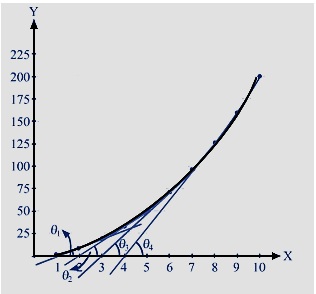
y 2 8 18 32 50 72 98 128 162 200
To find a slope at any point, draw a tangent at the point and extend the line to meet the x-axis. Then find tan θ as shown in the figure.
he above can be checked as follows:
Slope = ![]()
![]()
Here, x = x-coordinate of the point where the slope is to be measured
1