Draw the graph of each of the following equations:
(i) x = 5
(ii) y = -2
(iii) x + 6 = 0
(iv) x + 7 = 0
(v) y = 0
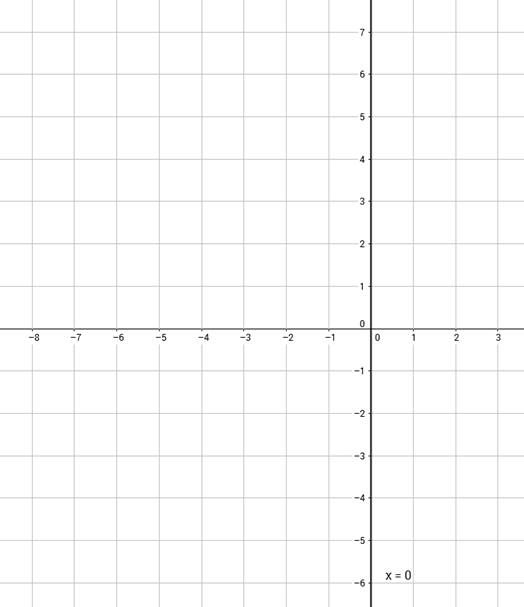
(vi) x = 0
(i) The given equation is x = 5
A line requires minimum of two points to be plot.
Thus we get the following table:
x | 5 | 5 |
y | 1 | -1 |
Plot points A (5,1) and B (5,-1) on the graph paper.
Join AB.
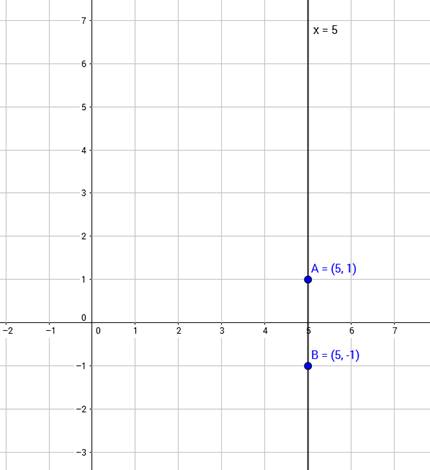
The line AB is the required graph.
(ii) The given equation is y = -2
A line requires minimum of two points to be plot.
Thus we get the following table:
x | 1 | 2 |
y | -2 | -2 |
Plot points A(1,-2) and B(2,-2) on the graph paper.
Join AB.
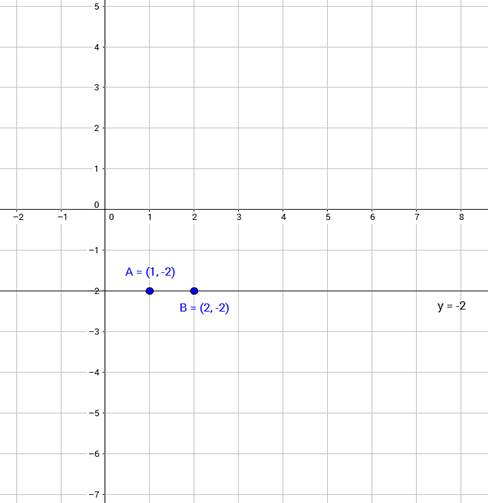
The line AB is the required graph
(iii) The given equation is x + 6 = 0, which means x = -6
A line requires minimum of two points to be plot.
Thus we get the following table:
x | -6 | -6 |
y | 1 | -1 |
Plot points A (-6,1) and B (-6,-1) on the graph paper.
Join AB.
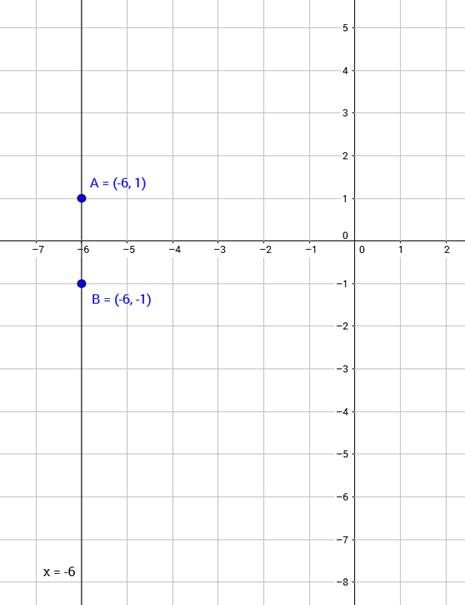
The line AB is the required graph
(iv) The given equation is x + 7 = 0, which means x = -7
A line requires minimum of two points to be plot.
Thus we get the following table:
x | -7 | -7 |
y | 1 | -1 |
Plot points A (-7,1) and B (-7,-1) on the graph paper.
Join AB.
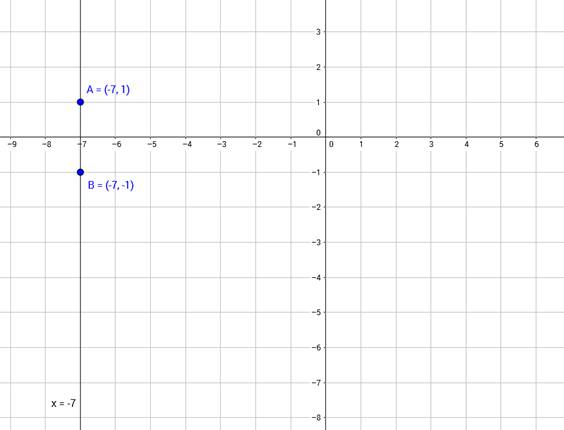
The line AB is the required graph
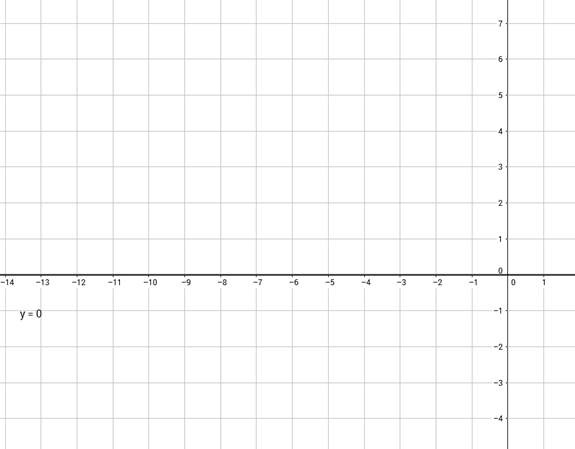
(v) Y =0 represents the x – axis
(vi) x = 0 represents y – axis