x = 0 is the equation of
Here, x = 0 is the equation of y-axis. Since, if we plot, x = 0 all the points will lie on y-axis irrespective of the value of y.
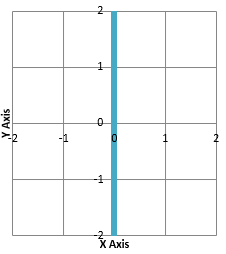
The blue line in the figure is the plotting of X = 0
which is also y-axis.
1
x = 0 is the equation of
Here, x = 0 is the equation of y-axis. Since, if we plot, x = 0 all the points will lie on y-axis irrespective of the value of y.
The blue line in the figure is the plotting of X = 0
which is also y-axis.