The graph of the linear equation 3x + 2y = 6 cuts the y-axis at the point
3x + 2y = 6
⇒ 2y = 6 – 3x
![]()
When x = 0, then,
![]()
![]()
![]()
![]()
When x = 2, then,
![]()
![]()
⇒ y = 0
Thus, we have the following table,
X | 0 | 2 |
Y | 3 | 0 |
Plotting these points we have the following graph,
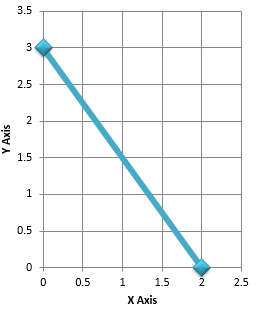
The blue line in the graph is the required line of the equation, 3x + 2y = 6
According to the graph, the equation,
3x + 2y = 6 cuts the y-axis at the point (0, 3)
8