The following table gives the production yield per hectare of wheat of 100 farms of a village.
Production yield (kg/ha) | 50 - 55 | 55 - 60 | 60 - 65 | 65 - 70 | 70 - 75 | 75 - 80 |
Number of farms | 2 | 8 | 14 | 24 | 38 | 16 |
Change the distribution to a 'more than type' distribution and draw its ogive. Using ogive, find the median of the given data.
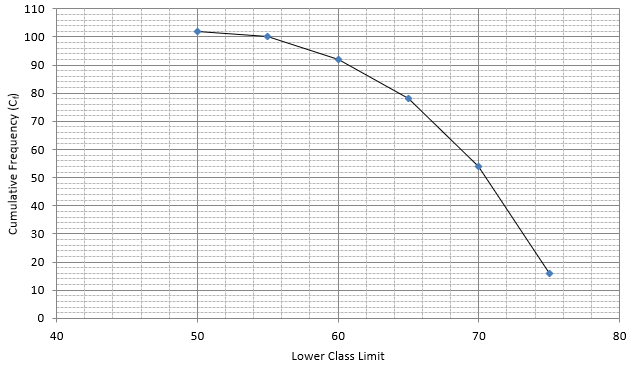
The frequency distribution table for ‘more than’ type is:
HEIGHT(cm) | CUMULATIVE FREQUENCY (Cf) |
more than 50 | 100 + 2 = 102 |
more than 55 | 92 + 8 = 100 |
more than 60 | 78 + 14 = 92 |
more than 65 | 54 + 24 = 78 |
more than 70 | 16 + 38 = 54 |
more than 75 | 16 |
Lets plot a graph of ‘more than’ ogive, taking lower limits of the class intervals on x - axis and cumulative frequencies on y - axis.
As we have N = 102 by the frequency table.
N/2 = 102/2 = 51
Mark 51 on y - axis and the corresponding point on x - axis would be the median.
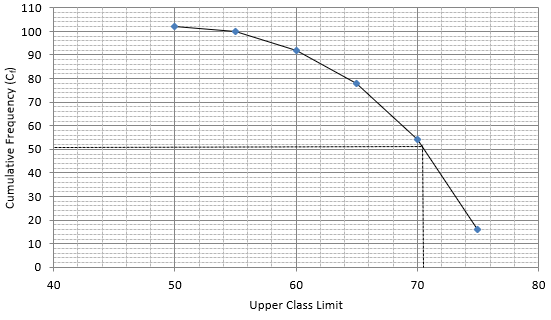
The corresponding point on x - axis is 70.5.
Hence, median is 70.5.