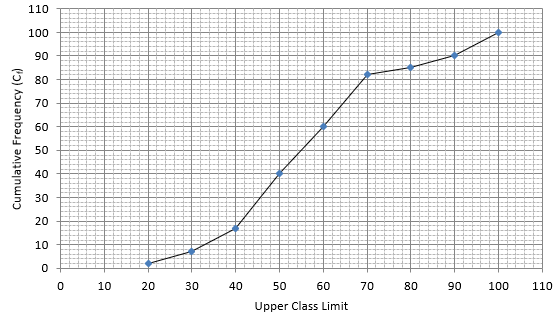
For the following distribution draw a 'less than type' ogive and from the curve find the median.
Marks obtained | Less than 20 | Less than 30 | Less than 40 | Less than 50 | Less than 60 | Less than 70 | Less than 80 | Less than 90 | Less than 100 |
Number of students | 2 | 7 | 17 | 40 | 60 | 82 | 85 | 90 | 100 |
Lets plot a graph of ‘less than ogive’, taking upper limits of the class intervals on x - axis and cumulative frequencies on y - axis.
As we have N = 100 by the frequency table.
N/2 = 100/2 = 50
Mark 50 on y - axis and the corresponding point on x - axis would be the median.
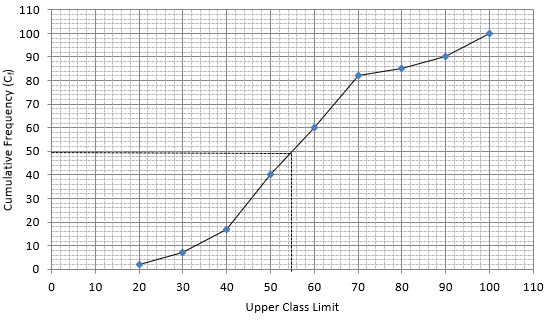
The corresponding point on x - axis is 55.
Hence, median is 55.
15