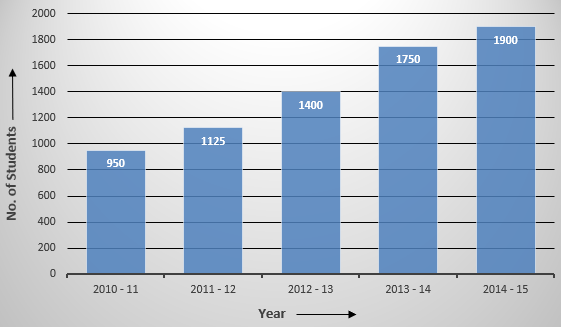
The following table shows the year-wise strength of a school.
Year | 2010-11 | 2011-12 | 2012-13 | 2013-14 | 2014-15 |
No. of students | 950 | 1125 | 1400 | 1750 | 1900 |
Represent the above data by a bar graph.
2
The following table shows the year-wise strength of a school.
Year | 2010-11 | 2011-12 | 2012-13 | 2013-14 | 2014-15 |
No. of students | 950 | 1125 | 1400 | 1750 | 1900 |
Represent the above data by a bar graph.