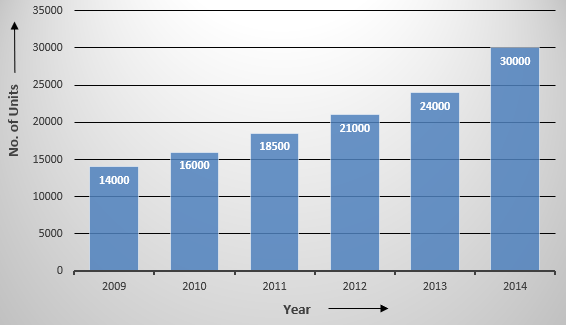
The following table shows the number of motorcycles produced by a company during six consecutive years.
2009 | 2010 | 2011 | 2012 | 2013 | 2014 |
14000 | 16000 | 18500 | 21000 | 24000 | 30000 |
Draw a bar graph to represent the above data.
7
The following table shows the number of motorcycles produced by a company during six consecutive years.
2009 | 2010 | 2011 | 2012 | 2013 | 2014 |
14000 | 16000 | 18500 | 21000 | 24000 | 30000 |
Draw a bar graph to represent the above data.