Given a consumption curve, outline the steps required to be taken in deriving a saving curve from it. Use diagram.
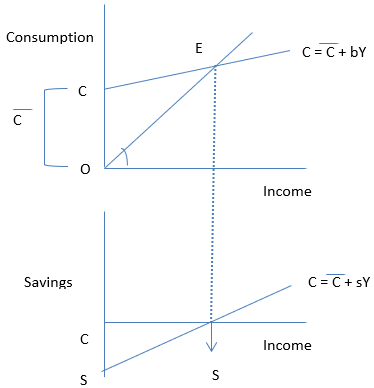
In the given diagram the consumption curve is given by ![]()
Where
C = autonomous consumption
Y = income
B = the rate at which consumption increases with increase in income
The aggregate supply curve is at 45 degree
Consumption is equal to Income at point E
Derivation of saving function from consumption function
S is the saving function
Where
Negative savings = autonomous consumption at Y = 0
This is shown on the negative axis in the lower panel
At point S here all the income is spent on consumption expenditure and the saving is 0, which is shown as breakeven point S after this point S and Y are joined to have a straight line sloping curve.
30