Draw a histogram for the following frequency distribution.

Let values in use of electricity be x-values and values in no. of families be y-axis.
Thus, this is the histogram.
9
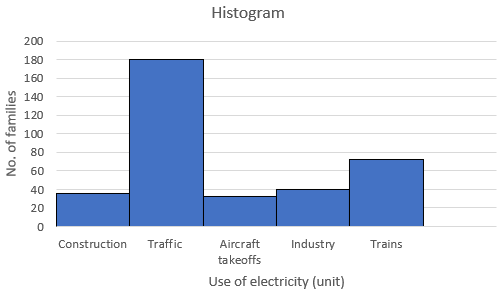
Draw a histogram for the following frequency distribution.
Let values in use of electricity be x-values and values in no. of families be y-axis.
Thus, this is the histogram.