In the following grouped frequency distribution table class marks are given.

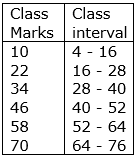
(i) Construct class intervals of the data. (Exclusive class intervals)
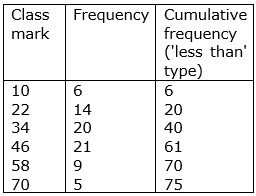
(ii) Construct less than cumulative frequencies and
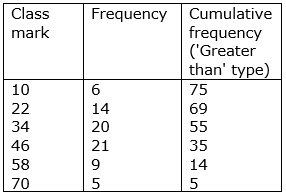
(iii) Construct greater than cumulative frequencies.
(i) As the difference between two consecutive class intervals is 12, we can evaluate the exclusive class intervals as,
Lower limit = class mark - 6
Upper limit = class mark + 6
(ii)
(iii)
4