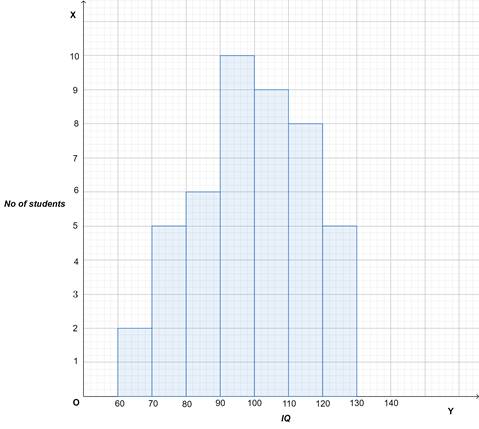
The following table gives the distribution of 45 students across the different levels of Intelligent Quotient. Draw the histogram for the data.

1
The following table gives the distribution of 45 students across the different levels of Intelligent Quotient. Draw the histogram for the data.