Ages of 60 teachers in primary schools of a Mandal are given in the following frequency distribution table. Construct the Frequency polygon and frequency curve for the data without using the histogram. (Use separate graph sheets)

For above problem, let us first calculate class marks for each interval.
Class mark![]()
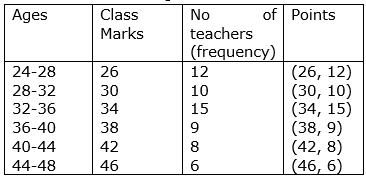
Now using points, we can make frequency curve and frequency polygon.
Frequency Polygon
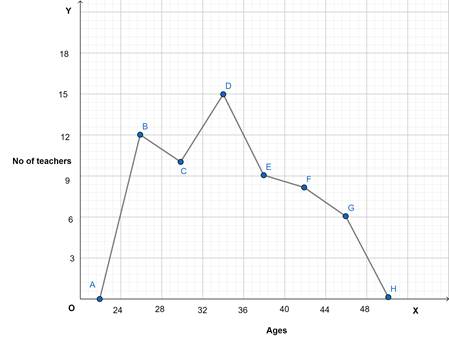
Frequency Curve
4