Draw the graph of each of the following linear equations.
y = -2x
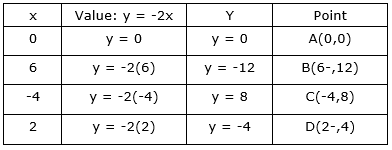
For graph, we’ll first make the table of solutions by putting some random values of x and thereafter we’ll find corresponding values of y and then we’ll plot these points on graph, join them and extend them in straight line to find the graph.
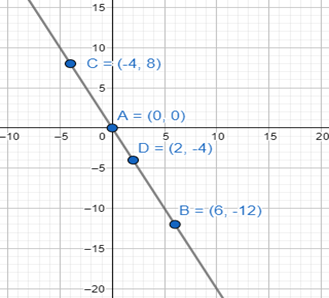
(Note: ∵ equation is linear graph will always be straight line.)
Table of solutions for the given equation-
GRAPH:
2