In a election 60% of voters cast their votes. Form an equation and draw the graph for this data. Find the following from the graph.
(i) The total number of voters, if 1200 voters cast their votes
(ii) The number votes cast, if the total number of voters are 800
[Hint: If the number of voters who cast their votes be ‘x’ and the total number of voters be ‘y’ then x = 60% of y.]

Let the number of voters who cast their votes be ‘x’ and the total number of voters be ‘y’
⇒ x = 60% of y
![]()
![]()
⇒ 5x = 3y is the equation.
For graph, we’ll first make the table of solutions by putting some random values of x and thereafter we’ll find corresponding values of y and then we’ll plot these points on graph, join them and extend them in straight line to find the graph.
(Note: ∵ equation is linear graph will always be straight line.)
Table of solutions for the given equation-
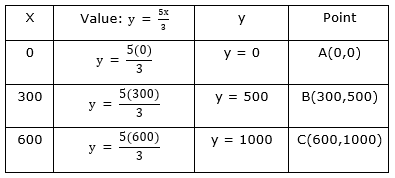
GRAPH:
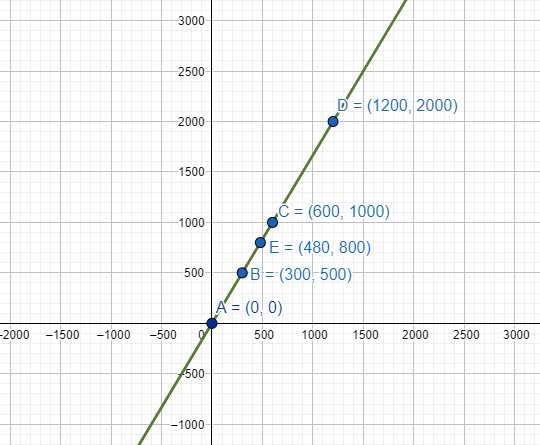
From the graph we can see that for x = 1200, the value of y = 2000
And for y = 800, the value of x = 480
(where, no. of voters who cast their vote = x, and Total no. of voters = y)