Identify the scale used on the axes of the adjacent graph. Write the frequency distribution from it.

Observe that, on x-axis we have classes from I Class to VI Class.
The scale used in x-axis is class on a unit interval.
And on y-axis, we have number of students.
The scale used on y-axis is from 0 to 90 with an interval of 10 units.
Analyzing a histogram is very easy. Just note down the parameters and its corresponding frequencies by observing the bar graph.
There are 6 parameters for classes namely, I Class, II Class, III Class, IV Class, V Class and VI Class.
So now, create a table consisting of these classes and their corresponding frequencies (number of students).
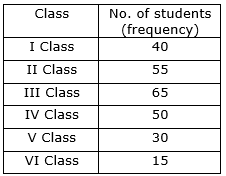
Thus, this is the required frequency distribution table.
6