The time taken by 25 women and 23 men to complete a race are given in the table below. Draw separte histograms for men and women.

Let us understand what a histogram is.
A histogram is a diagram of statistical information that uses rectangles to show the frequency of data items in successive numerical intervals of equal size.
Represent the data in tabular form showing midpoints of the intervals.
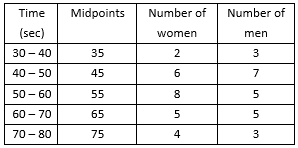
First making histogram of number of women.
Take these midpoints in x-axis and number of women in y-axis, then plot on a graph paper preferably.

Now, making histogram of number of men.
Take these midpoints in x-axis and number of men in y-axis, then plot on a graph paper preferably.
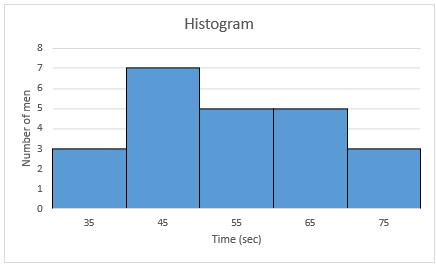
These are the histograms we are looking for.
4