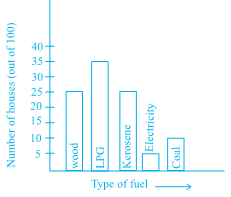
The following bar graph shows the number of houses (out of 100) in a town using different types of fuels for cooking.
Read the bar graph and answer the following questions:
Scale: 1 unit length = 5 houses

A. Which fuel is used in maximum number of houses?
B. How many houses are using coal as fuel?
C. Suppose that the total number of houses in the town is 1 lakh.
From the above graph estimate the number of houses using electricity.
(A) LPG
From the above bar graph, it is observed that the LPG bar is the highest among other fuels with 35 houses using it out of 100 and thus it is used in maximum number of houses.
(B) 10
From the above bar graph, it can be observed that 10 houses use coal as fuel.
(C) 5000
From the above graph , it can be observed that the number of houses using electricity are 5 out of 100 houses.
Now, if the number of houses = 100000
Number of houses using electricity out of 100 = 5
Number of houses using electricity = ![]()
Number of houses using electricity out of 100000 = ![]()
= 5000
Therefore, 5000 houses uses electricity out of 100000.