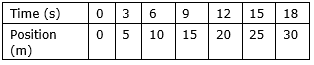
Draw the position-time graph with the given data.
The graph is drawn in this manner because it has all points with same difference and hence it would not matter if we draw all points on the axis of position and time that is 1,2,3,……
Then also the curve of the graph obtained will be straight line.
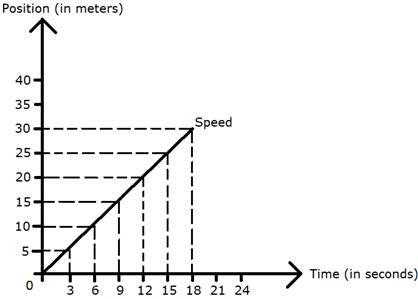
Always remember – The curve of the graph between position(Y-axis) and time(X-axis) represents Speed or velocity.
Mathematically,
![]()
Where, v is velocity; d is displacement; t is time.
The straight line of the graph represents that the speed is constant and acceleration is zero(0). Velocity is the rate of change of displacement with respect to time whereas speed is the rate of change of distance with respect to time(time interval in which the change of distance or displacement took place).