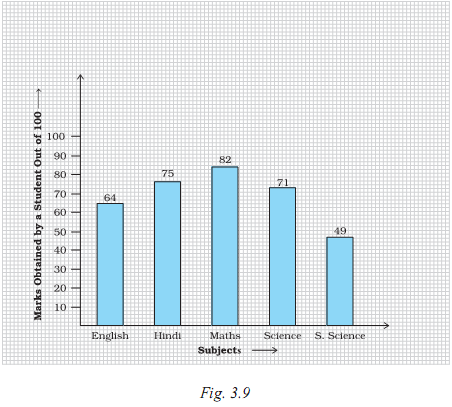
Study the bar graph given below and answer the questions that follow :
A. What information is depicted from the bar graph?
B. In which subject is the student very good?
C. Calculate the average marks of the student.
D. If 75 and above marks denote a distinction, then name the subjects in which the student got distinction.
E. Calculate the percentage of marks the student got out of 500.
(A) This graph depicts the marks obtain by student in all subjects out of 100
(B) In Maths the student is very good
As We can see he scores maximum marks 89 out of 100 as compare to all others subject
(C) Mean = ![]()
Sum of marks = 64 + 75 + 82 + 71 + 49
= 341
Average marks of students = ![]()
= 68.2
(D) If 75 and above marks are called distinction then
Student got distinction in only 2 subjects
Hindi and Maths
In Hindi he scores 75
And in maths he scores 82
(E) Percentage = ![]()
Sum of marks got by student = 341
Maximum marks of 5 subject = 5× 100
= 500
∵ Subject marks are out f 100
Percentage = ![]()
= 68.2 %