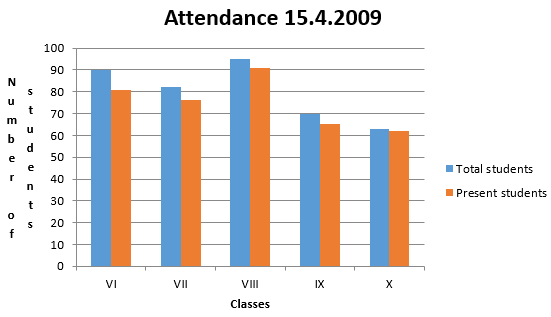
Observe the following data:

A. Draw a double bar graph choosing an appropriate scale. What do you infer from the bar graph?
B. Which class has the maximum number of students?
C. In which class, the difference of total students and number of students present is minimum?
D. Find the ratio of number of students present to the total number of students of Class IX.
E. What per cent of Class VI students were absent?
(A) 
This graph depicts the total number of students and among them how many are present in each class
(B) Class VIII has maximum number of students
∵ there are total 95 students in the class which is maximum among all classes
(C) It is minimum in X class
As there is only one student absent
(63-62)
(D) in class IX
Total number of students = 70
Total number of present students = 65
Ratio
70:65 = 13:14
(E) In class VI
Total number of students = 90
Total number of present students = 81
Absent students = 90-81 = 9
Percentage of absent student is ![]()
Percentage of absent student is ![]()
= 10%