Draw a frequency polygon for the following data without using histogram

GIVEN.
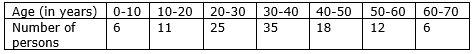
⇒ As the data is in continuous forms
⇒ Take out Midpoints of Each class intervals
Table will be
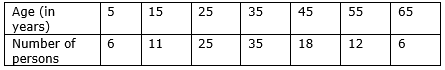
⇒ Mark class interval along X axis on uniform scale
⇒ Mark frequency along Y axis on uniform scale
Take 2 imaginary midpoints on 1st and last with 0 frequency
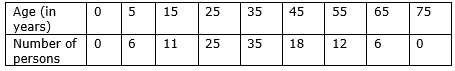
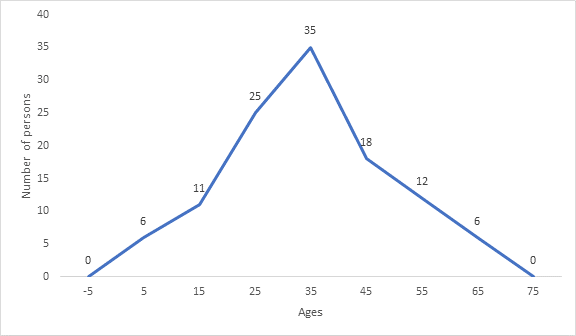
⇒ join all the midpoints to get frequency polygon
8