1 plot the following points on graph paper and write the points lie above or below the x-axis.
(3, –2), (–4, 2), (4, 5), (–5, –5), (–2, 7), (7, –7), (0, 9), (0, –9)
(3,-2)
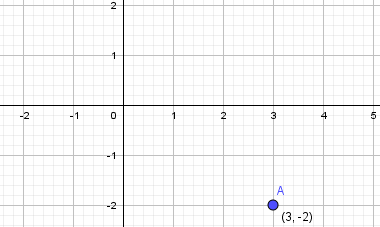
The point lies below the x- axis.
(-4, 2)
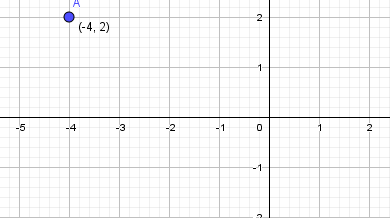
The point lies above the x-axis.
(4,5)
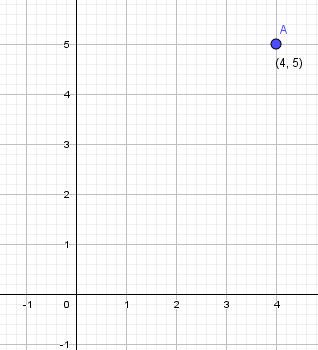
The point lies above the x-axis.
(-5, -5)
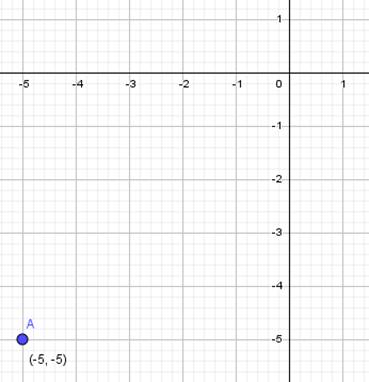
The point lies below the x-axis.
(-2, 7)
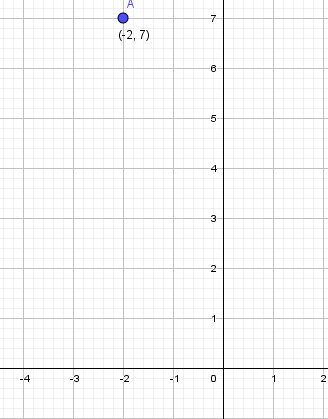
The point lies above the x-axis.
(7, -7)
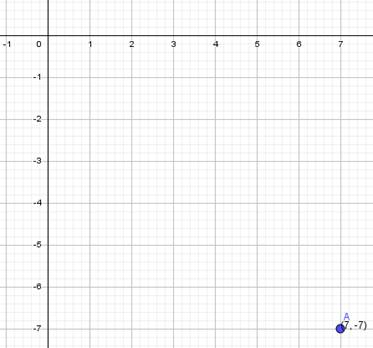
The point lies below the x-axis.
(0, 9)
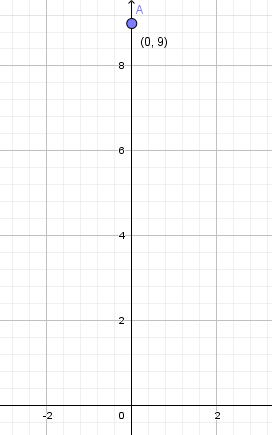
The point lies above the x-axis.
(0, -9)
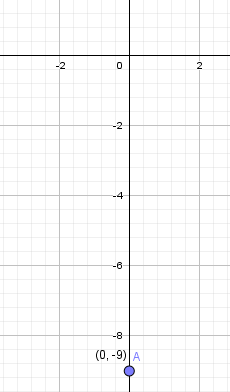
The point lies below the x-axis.
1