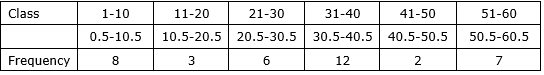
I draw the histogram of the frequency distribution table given below:
Making the class continuous.
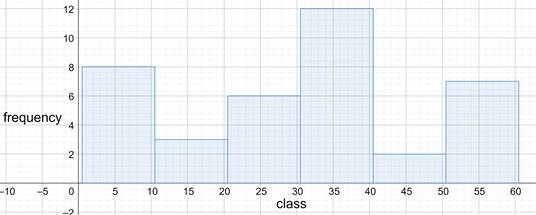
Now, the histogram