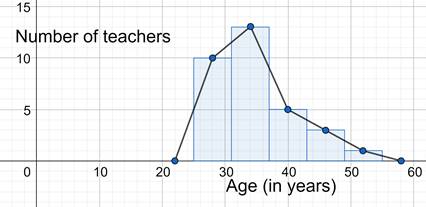
I have written the ages of 32 teachers of Primary School in the village Virsingha in a table given below:

I represent the above given data graphically by histogram and frequency polygon.
By using the data

We make a histogram and then by joining middle values of classes we get the frequency polygon.

9