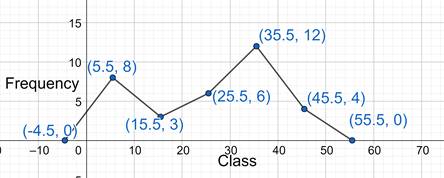
I draw the frequency polygon for the following frequency distribution table.
![]()
Making the class continuous.

Now, we will find the middle-class values

We can see that the middle-class value would have came same even if we didn’t find the continuous class.

11