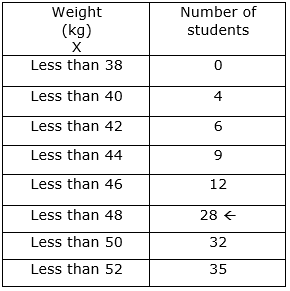
The following data shows the weight of 35 students of class of Nivedita.

Making cumulative frequency (less than type) distribution table, let us draw Ogive on graph paper and hence let us find the median from the graph. Let us find the median by using formula and verify it.
We have been given data of weight in less than type and data of number of students.
We have
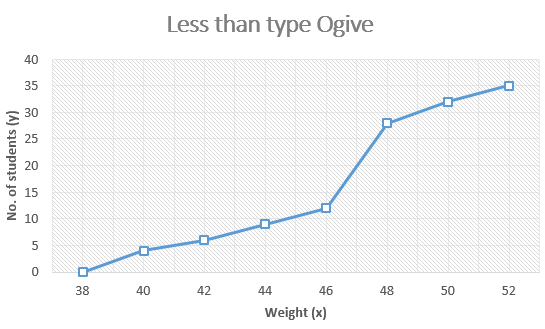
Taking weight as x-axis and number of students as y-axis.
Thus plotting the points on a graph, we get
Now we need to plot median in the graph and then verify it using the formula.
So, note that total number of students are 35.
⇒ N = 35
Find N/2.
![]()
⇒ ![]()
Draw a line parallel to x axis, passing through 17.2 on y-axis intersecting the less than ogive.
We have graphically,
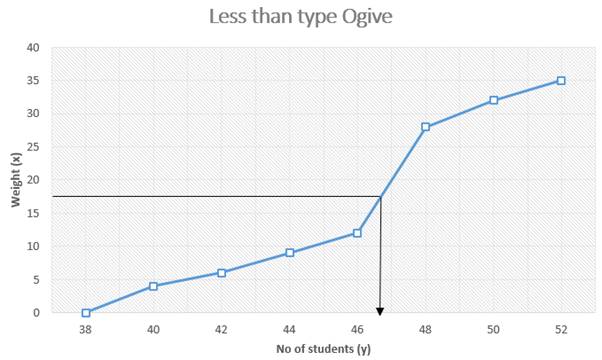
We can notice from the graph, the line intersecting the ogive touches the y-axis at 46.7.
Now, let us solve theoretically,
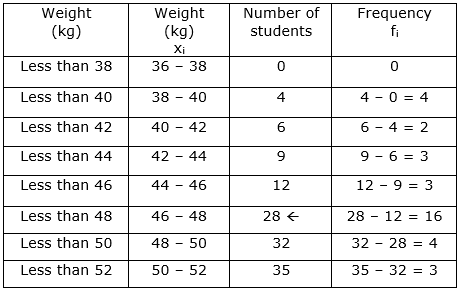
Let us make a table showing frequencies and class intervals.
Since, ![]()
Observe, cf = 28 is just greater than 17.5.
Thus, median class = 46 – 48
Median is given by
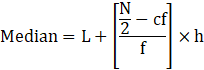
Where,
L = Lower class limit of median class = 46
N/2 = 17.5
cf = cumulative frequency of the class preceding median class = 12
f = frequency of the median class = 16
h = class interval of the median class = 2
Substituting these values in the formula of median, we get
![]()
⇒ ![]()
⇒ Median = 46 + 0.6875
⇒ Median = 46.6875
Thus, the median of data is 46.6875 and it is verified.