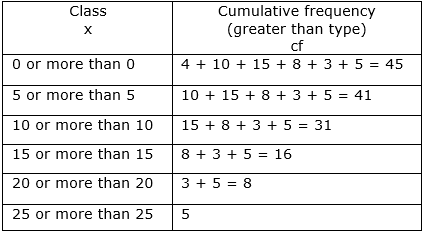
Making cumulative frequency (greater than type) distribution table of given data, let us drawn Ogive on graph paper.
We have been given class intervals and frequency.
Let us create greater than type of cumulative frequency distribution table.

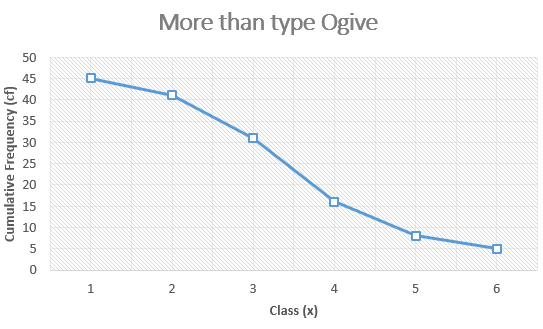
Taking Class as x-axis and cumulative frequency as y-axis.
Thus plotting the points on a graph, we get

Thus, this is the more than type Ogive on graph paper.
3