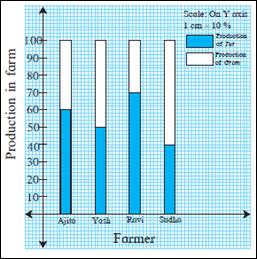
Observe the following graph and answer the questions.
(1) State the type of the bar graph.
(2) How much percent is the Tur production to total production in Ajita’s farm?
(3) Compare the production of Gram in the farms of Yash and Ravi and state whose percentage of production is more and by how much?
(4) Whose percentage production of Tur is the least?
(5) State production percentages of Tur and gram in Sudha’s farm.
(1) The given graph is a Percentage-Bar Graph.
(2) According to the graph, the percentage of Tur production with respect to total production in Anita's farm
![]()
(3) According to the graph,
Percentage production of Gram in Yash's farm = (100-50)%
= 50%
Percentage production of Gram in Ravi's farm = (100-70)%
=30%
Clearly,
the percentage production of Yash is greater than Ravi's farm.
Difference of their production = (50-30)%
=20%
∴ The Gram production of Yash is 20% more than that of Ravi.
(4) Percentage production of Tur in Ajita's farm = 60%
Percentage production of Tur in Yash's farm = 50%
Percentage production of Tur in Ravi's farm = 70%
Percentage production of Tur in Sudha's farm = 40%
Clearly,
Percentage production of Tur in Sudha's farm is the least.
(5) Production percentage of Tur in Sudha's farm = 40%
Production percentage of Gram in Sudha's farm = (100-40)%
= 60%