The function f is defined by  . Draw the graph of f(x).
Given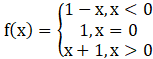
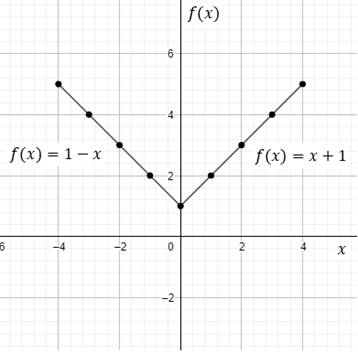
When x < 0, we have f(x) = 1 – x
f(–4) = 1 – (–4) = 1 + 4 = 5
f(–3) = 1 – (–3) = 1 + 3 = 4
f(–2) = 1 – (–2) = 1 + 2 = 3
f(–1) = 1 – (–1) = 1 + 1 = 2
When x = 0, we have f(x) = f(0) = 1
When x > 0, we have f(x) = 1 + x
f(1) = 1 + 1 = 2
f(2) = 1 + 2 = 3
f(3) = 1 + 3 = 4
f(4) = 1 + 4 = 5
Plotting these points on a graph sheet, we get
7