The figure shows two sinusoidal curves representing oscillating supply voltage and current in an AC circuit.
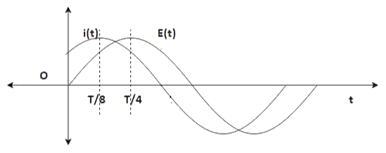
Draw a phasor diagram to represent the current and supply voltage appropriately as phasors. State the phase difference between the two quantities.
The figure clearly indicates that voltage is lagging the current by a phase difference say Φ, so we can write as,
V(t)=V0 sinωt
And,
I(t)=I0 sin(ωt+ϕ)
At t=![]() , I=I0
, I=I0
![]()
Also, at t=![]() , V=V0
, V=V0
![]()
![]()
![]()
![]()
Substituting the value of angular frequency in the current relation we get,
![]()
![]()
![]()
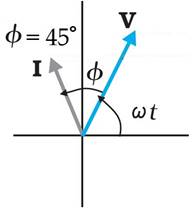
The corresponding phasors can be drawn as,
8