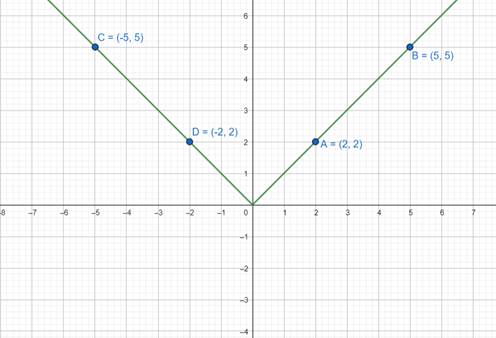
Draw the graph of y = |x|.
We know that y = |x| means that y always remains positive
y = x, x ≥ 0
y = -x, x ≤ 0
Now, for values greater than 0, we get,
At x = 2, y = 2
At x = 5, y = 5
Now, values less than 0, we get,
At x = -2, y = 5
At x = -5, y = 5
Therefore, plotting the graph we get,
17