Derive a straight line saving curve using the following consumption function:
C = 20 + 0.6Y, presuming the income levels to be 100, 200 and 300 crores. Also, calculate that level of income where consumption is equal to income.
C = 20 + 0.6Y
Y = C + S
At different levels of income C will be:
At Y = 100
C = 20 + 0.6Y
= 20 + 0.6 (100)
= 20 + 60
= 80
When C is 80 the Savings S will be
Y = C + S
100 = 80 + S
100 – 80 = S
S = 20
At Y = 200
C = 20 + 0.6 (200)
= 20 + 120
= 140
When C is 140 the Savings ‘S’ will be
Y = C + S
= 140 + S
200 = 140 + S
200 – 140 = S
S = 60
At Y = 300
C = 20 + 0.6 (300)
= 20 + 180
= 200
When C is 200 the Savings ‘S’ will be
Y = C + S
300 = 200 + S
300 – 200 = S
S = 100.
• When the income level is 100 Rs the Consumption ‘C’ is 80 and Savings is 20.
• When the income level is 200 Rs the Consumption ‘C’ is 140 and Savings is 60.
• When the income level is 300 Rs the Consumption ‘C’ is 200 and Savings is 100
This shows when there is an increase in the level of income the consumption increases and savings also increases. Since the savings are increases from 20 to 100, therefore, the curve of the savings will be increasing straight line.
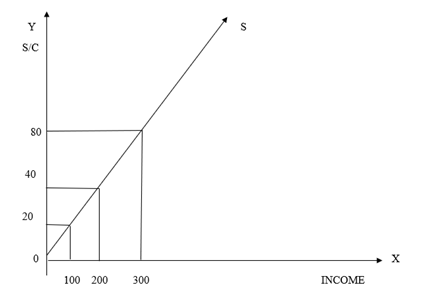
100 200 300 INCOME
The level of income where consumption is equal to income is:
Y = 20+0.6Y
Y-0.6Y = 20
0.4Y = 20
Y = 50