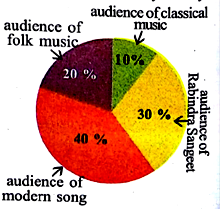
Let’s see the pie chart below and find the answers to the questions.
The pie-chart of what kind of programmes the audience likes –

i. Let’s write how many parts of the total circular region is the sector of the audience who watch news in the pie chart.
ii. Let’s write what kind of programme gets the most audience.
iii. Let’s write what kind of programme gets the least audience
iv. Let’s write how many parts of the total audience watch the programmes of sports.
i. We can see for news; the coverage is 20° and total pie- chart is for 360°
⇒ ![]()
∴ the sector of the audience who watch news in the pie chart is ![]()
ii. We can see for entertainment-based sector we have the most area=240°
=![]()
∴ the sector of the audience who watch entertainment-based part in the pie chart=66.66 %
iii. We can see for information-based sector we have the least area=10°
⇒![]()
∴ the sector of the audience watch informative programmes the least.
iv. We can see for sports based sector we have the area=90°
![]()
∴ the sector of the audience who watch sports-based part is 1/4 th.
Couldn't generate an explanation.
Generated by AI. May contain inaccuracies — always verify with your textbook.