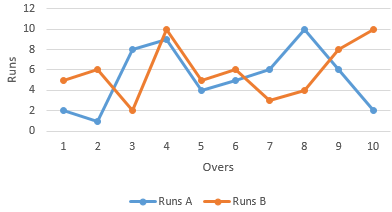
The runs scored by two teams A and B in first 10 overs are given below :
Overs | I | II | III | IV | V | VI | VII | VIII | IX | X |
Team A : | 2 | 1 | 8 | 9 | 4 | 5 | 6 | 10 | 6 | 2 |
Team B : | 5 | 6 | 2 | 10 | 5 | 6 | 3 | 4 | 8 | 10 |
Draw a graph depicting the data, making the graphs on the same axes in each case in two different ways as a graph and as a bar chart.
we take overs on x-axis and runs on y-axis.
Let us choose the following scale:
On x-axis: 1 cm = 1 over
On y-axis: 1 cm = 2 run
Now, let us plot given points for team A and for team B. These points are joined to get the graph representing the given information as shown in the figure below.
Now we plot bar graph

AI is thinking…
Couldn't generate an explanation.
Generated by AI. May contain inaccuracies — always verify with your textbook.