Median = ?
Medium is given by,
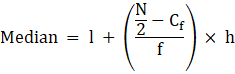
Where
N = Sum of frequencies,
h = length of median class,
l = lower boundary of the median class,
f = frequency of median class
and Cf = cumulative frequency
AI is thinking…
Couldn't generate an explanation.
Generated by AI. May contain inaccuracies — always verify with your textbook.