Skip to content
Philoid
Browse Saved
Back to chapter
Maths
2. Data Handling
Home · Class 8 · Maths · NCERT - Exemplar Mathematics · 2. Data Handling
Prev
Next
Q110 of 116 Page 42

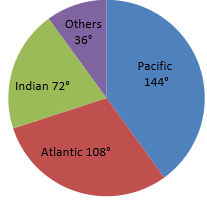
The following data represents the approximate percentage of water in various oceans. Prepare a pie chart for the given data.

Pacific 40%


Atlantic 30%


Indian 20%


Others 10%

Total amount = 40 + 30 + 20 + 10 = 100


Central angle for-


More from this chapter

All 116 →
108

In the time table of a school, periods allotted per week to different teaching subjects are given below:


Draw a pie chart for this data.

109

A survey was carried out to find the favourite beverage preferred by a certain group of young people. The following pie chart shows the findings of this survey.

From this pie chart answer the following:


(i) Which type of beverage is liked by the maximum number of people.


(ii) If 45 people like tea, how many people were surveyed?


111

At a Birthday Party, the children spin a wheel to get a gift. Find the probability of

(a) getting a ball


(b) getting a toy car


(c) any toy except a chocolate


112

Sonia picks up a card from the given cards.


Calculate the probability of getting


(a) an odd number


(b) a Y card


(c) a G card


(d) B card bearing number > 7

Questions · 116
2. Data Handling
1 2 3 4 5 6 7 8 9 10 11 12 13 14 15 16 17 18 19 20 21 22 23 24 25 26 27 28 29 30 31 32 33 34 35 36 37 38 39 40 41 42 43 44 45 46 47 48 49 50 51 52 53 54 55 56 57 58 59 60 61 62 63 64 65 66 67 68 69 70 71 172 73 74 75 76 77 78 79 80 81 82 83 84 85 86 87 88 89 90 91 92 93 94 95 96 97 98 99 100 101 102 103 104 105 106 107 108 109 110 111 112 113 114 115 116
Back to chapter
ADVERTISEMENT
About Contact Privacy Terms
Philoid · 2026
  • Home
  • Search
  • Browse
  • Quiz
  • Saved