Skip to content
Philoid
Browse Saved
Back to chapter
Maths
10. Graphs
Home · Class 10 · Maths · Ref. Book · 10. Graphs
Prev
Next
Q5 of 19 Page 278

Draw the Graph of xy = 20, x, y > 0. Use the graph to find y when x = 5, and to find x when y = 10.

We are given that xy


= 20


⇒ y = (20/x)


We can find different value of Y by taking values of x between 1 and 10


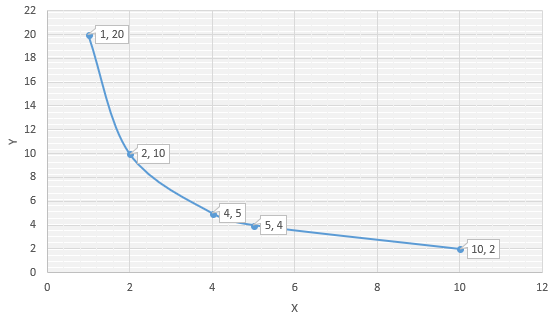
From the graph we get that at x = 5, y = 4, and to find y = 10, x = 2


More from this chapter

All 19 →
2

The following table gives the cost and number of notebooks bought.


Draw the graph and hence (i) find the cost of seven note books.


(ii) How many note books can be bought for ₹165.

3


Draw the graph for the above table and hence find


(i) the value of y if x = 4


(ii) the value of x if y = 12

4

The cost of the milk per liter is ₹15. Draw the graph for the relation between the quantity and cost. Hence find

(i) the proportionality constant.


(ii) the cost of 3 litres of milk.

6


Draw graph for the data given in the table. Hence find the number of days taken by 12 workers to complete the work.

Questions · 19
10. Graphs
1 1 1 1 2 2 2 2 3 4 5 6 7 1 2 3 4 5 6
Back to chapter
ADVERTISEMENT
About Contact Privacy Terms
Philoid · 2026
  • Home
  • Search
  • Browse
  • Quiz
  • Saved