Q83 of 91 Page 72

Observe the following data:


A. Draw a double bar graph choosing an appropriate scale. What do you infer from the bar graph?


B. Which class has the maximum number of students?


C. In which class, the difference of total students and number of students present is minimum?


D. Find the ratio of number of students present to the total number of students of Class IX.


E. What per cent of Class VI students were absent?

(A)


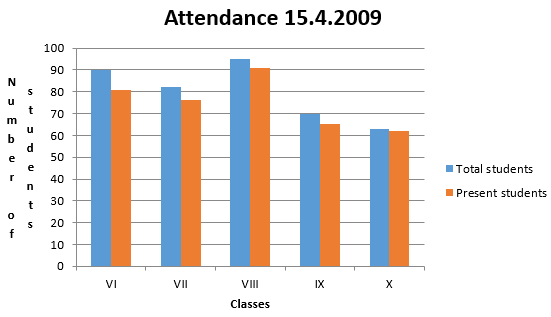
This graph depicts the total number of students and among them how many are present in each class


(B) Class VIII has maximum number of students


there are total 95 students in the class which is maximum among all classes


(C) It is minimum in X class


As there is only one student absent


(63-62)


(D) in class IX


Total number of students = 70


Total number of present students = 65


Ratio


70:65 = 13:14


(E) In class VI


Total number of students = 90


Total number of present students = 81


Absent students = 90-81 = 9


Percentage of absent student is


Percentage of absent student is


= 10%


More from this chapter

All 91 →
81

Study the double bar graph and answer the questions that follow:


A. What information does the double bar graph represent?


B. Find the total number of boys in all sections of Class VII.


C. In which sections, the number of girls is greater than the number of boys?


D. In which section, the number of boys is the maximum?


E. In which section, the number of girls is the least?

82

In a public library, the following observations were recorded by the librarian in a particular week:


A. Draw a double bar graph choosing an appropriate scale.


B. On which day, the number of readers in the library was maximum?


C. What is the mean number of magazine readers?

84

Observe the given data:


A. Draw a bar graph to represent the above given information.


B. On which day of the week was the sales maximum?


C. Find the total sales during the week.


D. Find the ratio of the minimum sale to the maximum sale.


E. Calculate the average sale during the week.


F. On how many days of the week was the sale above the average sales?

85

Below is a list of 10 tallest buildings in India. This list ranks buildings in India that stand at least 150m (492 ft.) tall, based on standard height measurement. This includes spires and architectural details but does not include antenna marks. Following data is given as per the available information till 2009. Since new buildings are always under construction, go on-line to check new taller buildings.

Use the information given in the table about sky scrapers to answer the following questions:


A. Find the height of each storey of the three tallest buildings and write them in the following table:


B. The average height of one storey for the buildings given in (a) is ___________.


C. Which city in this list has the largest percentage of skyscrapers? What is the percentage?


D. What is the range of data?


E. Find the median of the data.


F. Draw a bar graph for given data.