Figure X showa a trace of a sound wave produced by a particular tuning fork:
Picture

(a) On the graph paper given in Figure Y, draw a trace of the sound wave which has higher frequency than that shown in Figure X.
(b) On the graph paper shoen in Figure Z, draw a trace of the sound wave which has a larger amplitude than that shown in Figure X.
(a) 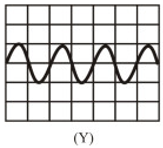
(b) 
AI is thinking…
Couldn't generate an explanation.
Generated by AI. May contain inaccuracies — always verify with your textbook.