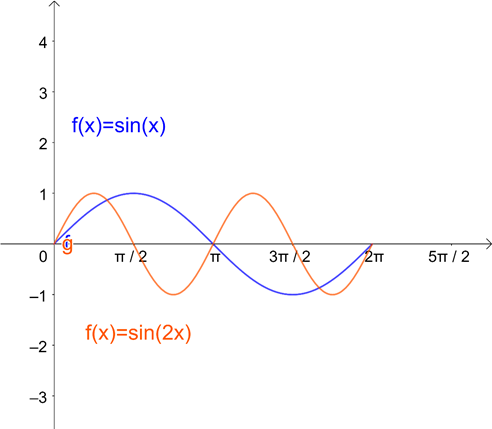
Sketch the graphs of the following pairs of functions on the same axes :
f(x) = sin x, g(x) = sin 2x
We observe that the functions f(x) = sin x and g (x) = sin 2x are periodic functions with periods 2π and π.
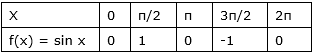
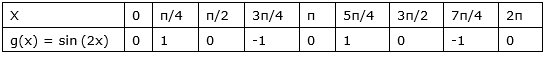
The values of these functions are tabulated below:
Values of f (x) = sin x in [0, 2π]
Values of g (x) = sin (2x) in [0, π]
By plotting the above points, we obtain the required curve.
AI is thinking…
Couldn't generate an explanation.
Generated by AI. May contain inaccuracies — always verify with your textbook.

