Draw the graph of each of the following functions:
![]()
To draw the graph of the curve sin(x/2) assume some standard angle measures which will help in locating the points and drawing the curve.
X |
|
|
| π |
|
|
sin(x/2) |
|
|
| 1 |
| 0 |

Therefore, the graph of curve 2cos(3x) can be drawn as
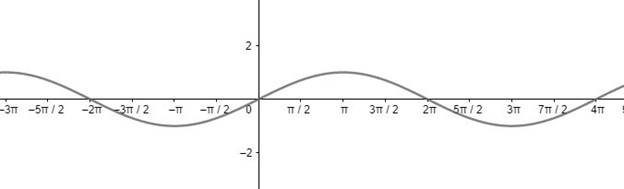
Here, the frequency of the function sin(x) is decreased by 0.5 times.
AI is thinking…
Couldn't generate an explanation.
Generated by AI. May contain inaccuracies — always verify with your textbook.