Draw the graphs of y = sin x and ![]() on the same axes.
on the same axes.
For sinx

For cosx

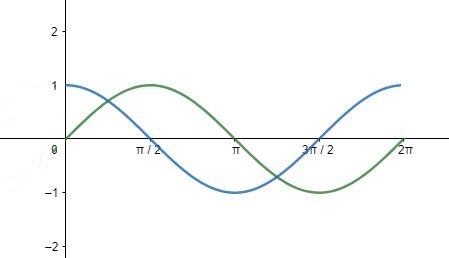
The green line represents curve for sin(x) and blue for cos(x) for [0,2π].
AI is thinking…
Couldn't generate an explanation.
Generated by AI. May contain inaccuracies — always verify with your textbook.
