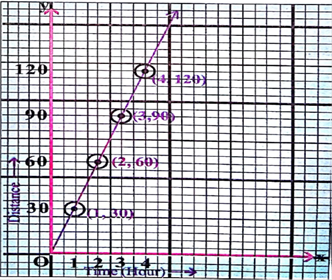
Let’s see the graph on the graph paper beside and let’s find the answers to the questions below:

(i) Let’s write the relation between the number of guava and the price of guava from the graph.
(ii) Let’s write the price of 4 guavas.
(iii) Let’s write the number of guavas in Rs 30 from the graph.
(iv) Let’s write the number of guavas in Rs. 9
(v) Let’s write the price of 9 guavas from the graph.
(i) From the given condition for x and y axis, and observing from the graph it can be seen that the one guava cost 3 rupees. And the graph shows the sale of 10 guavas.
(ii) As one guava cost 3 rupees hence 4 guavas cost 4×3=12 rupees. And from the graph it can be seen that (4, 12) is one of the point on the line, so the x coordinate represents the number of guavas and y coordinates represents the cost of those guavas.
(iii) From the graph it can be seen that for Rs. 30 we get 10 guavas as (10, 30) is a point on the line. And from relation, as one guava cost 3 rupees hence 4 guavas cost 10×3=30 rupees.
(iv) From the graph it can be seen that for Rs. 9 we get 3 guavas as (3, 9) is a point on the line. And from relation, as one guava cost 3 rupees hence 4 guavas cost 3×3=9 rupees.
(v) As one guava cost 3 rupees hence 9 guavas cost 9×3=27 rupees. And from the graph it can be seen that (9, 27) is a point on the line, so the x coordinate represents the number of guavas and y coordinates represents the cost of those guavas.
Couldn't generate an explanation.
Generated by AI. May contain inaccuracies — always verify with your textbook.