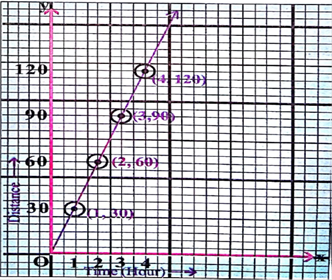
Let’s draw the graph on the graph paper of the following data and see whether it is a line graph.
Let 2 hour=length of 5 sides of the smallest squares along x-axis i.e., x-axis represents the time in hours.
And 20km = length of 5 sides of the smallest square along y-axis i.e., y-axis represent the distance in km.

The points of the graph can be represented as shown above. They lie on a line.
A graph in which we obtain a line on joining all the points is called a liner graph. Hence the graph obtained from the data given is a liner graph.
AI is thinking…
Couldn't generate an explanation.
Generated by AI. May contain inaccuracies — always verify with your textbook.