Skip to content
Philoid
Browse Saved
Back to chapter
Maths
7. Statistics
Home · Class 10 · Maths · Ref. Book · 7. Statistics
Prev
Next
Q4 of 141 Page 8

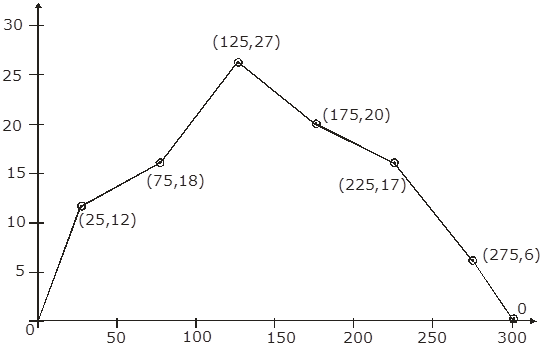
The monthly profits (in Rs.) of 100 shops are distributed as follows:


Profits per shop:


0-50


50-100


100-150


150-200


200-250


250-300


No. of shops:


12


18


27


20


17


6


Draw the frequency polygon for it.

We have,


Profit per shop


Mid value


No. of shops


Less than 0


0


0


0-50


25


12


50-100


75


18


100-150


125


27


150-200


175


20


200-250


225


17


250-300


275


6


Above 300


300


0


More from this chapter

All 141 →
2

The marks scored by 750 students in an examination are given in the form of a frequency distribution table:


Marks


No. of Students


600-400


16


640-680


45


680-720


156


720-760


284


760-800


172


800-840


59


840-880


18


Prepare a cumulative frequency table by less than method and draw an ogive.

3

Draw an ogive to represent the following frequency distribution:


Class-interval:


0-4


5-9


10-14


15-19


20-24


No. of students:


2


6


10


5


3


5

The following table gives the height of trees:


Height


No. of trees


Less than 7


26


Less than 14


57


Less than 21


92


Less than 28


134


Less than 35


216


Less than 42


287


Less than 49


341


Less than 56


360


Draw ‘less than’ ogive and ‘more than’ ogive.

6

The annual profits earned by 30 shops of a shopping complex in a locality give rise to the following distribution:


Profit (in lakhs in Rs.)


Number of shops (frequency)


More than or equal to 5


30


More than or equal to 10


28


More than or equal to 15


16


More than or equal to 20


14


More than or equal to 25


10


More than or equal to 30


7


More than or equal to 35


3


Draw both ogives for the above data and hence obtain the median.

Questions · 141
7. Statistics
1 2 3 4 5 6 7 8 9 10 11 12 13 14 15 1 2 3 4 5 6 7 8 9 1 2 3 4 5 6 7 8 9 10 11 12 13 14 15 16 17 18 19 20 21 22 23 24 25 1 2 3 4 5 6 7 8 9 10 11 12 13 14 15 16 17 18 19 1 2 3 4 5 6 7 8 9 10 11 12 13 14 15 16 17 1 2 3 4 5 6 7 8 9 1 2 3 4 5 6 7 8 9 10 11 12 1 2 3 4 5 6 7 8 9 10 11 12 13 14 15 16 17 18 19 20 21 22 23 24 25 26 27 28 29 30 31 32 33 34 35
Back to chapter
ADVERTISEMENT
About Contact Privacy Terms
Philoid · 2026
  • Home
  • Search
  • Browse
  • Quiz
  • Saved