Skip to content
Philoid
Browse Saved
Back to chapter
Maths
22. Constructing and Interpreting Bar Graphs
Home · Class 8 · Maths · Ref. Book · 22. Constructing and Interpreting Bar Graphs
Prev
Next
Q6 of 14 Page 242

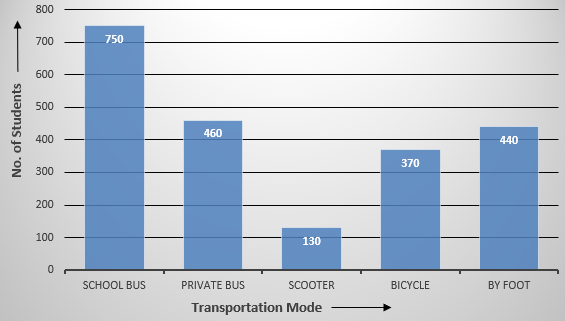
Various modes of transport used by 2150 students of a school are given below:


School bus


Private bus


Scooter


Bicycle


By foot


750


460


130


370


440


Draw a bar graph to represent the above data.


More from this chapter

All 14 →
4

The air distances of four cities from Delhi (in km) are given below:


City


Mumbai


Kolkata


Hyderabad


Chennai


Distance from Delhi (in km)


1100


1340


1220


1700


Draw a bar graph to represent the above data.

5

The following table shows the life expectancy (average age to which people live) in various countries in a particular year.


Country


India


Japan


Britain


Ethiopia


Cambodia


Life expectancy (in years)


65


80


75


50


45


Represent the above data by a bar graph.

7

The following table shows the number of motorcycles produced by a company during six consecutive years.


2009


2010


2011


2012


2013


2014


14000


16000


18500


21000


24000


30000


Draw a bar graph to represent the above data.

8

The present population (in lakhs) of six Indian states is given below:


Sate


Population (in lakhs)


Bihar


1040


Chhattisgarh


260


Jharkhand


330


Madhya Pradesh


720


West Bengal


910


Rajasthan


690


Represent the above data by a bar graph.

Questions · 14
22. Constructing and Interpreting Bar Graphs
1 2 3 4 5 6 7 8 9 10 11 12 13 14
Back to chapter
ADVERTISEMENT
About Contact Privacy Terms
Philoid · 2026
  • Home
  • Search
  • Browse
  • Quiz
  • Saved