Skip to content
Philoid
Browse Saved
Back to chapter
Maths
22. Constructing and Interpreting Bar Graphs
Home · Class 8 · Maths · Ref. Book · 22. Constructing and Interpreting Bar Graphs
Prev
Next
Q10 of 14 Page 242

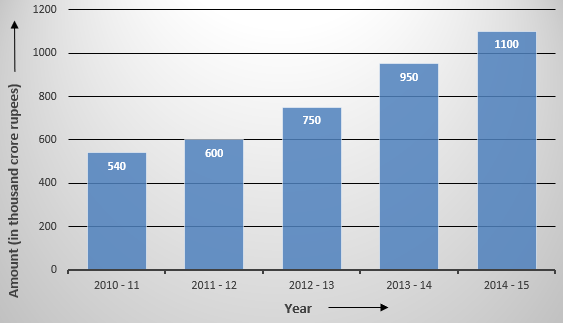
The following table shows the export earnings of India (in thousand crore rupees) during five consecutive years.


Year


2010-11


2011-12


2012-13


2013-14


2014-15


Export (in thousand crore rupees)


540


600


750


950


1100


Represent the above data by a bar graph.


More from this chapter

All 14 →
8

The present population (in lakhs) of six Indian states is given below:


Sate


Population (in lakhs)


Bihar


1040


Chhattisgarh


260


Jharkhand


330


Madhya Pradesh


720


West Bengal


910


Rajasthan


690


Represent the above data by a bar graph.

9

There are 1120 creatures in zoo as per list given below :


Beast animals


Other land animals


Water animals


Birds


Reptiles


220


410


165


190


135


Represent the above data by a bar graph.

11

The following data shows India’s total population (in millions) from 1961 to 2011.


Year


1961


1971


1981


1991


2001


2011


Population (in millions)


360


420


540


680


1020


1200


Represent the above data by a bar graph.

12

In a survey of 100 families of a village, the number of members in each family was recorded, as shown by the bar graph given below:


Read the bar graph carefully and answer the following questions.


(i) What does the bar graph show?


(ii) How many families have less than five members?


(iii) How many families have more than three members?


(iv) How many families have two children?


Or


(iv)How many families have two members?

Questions · 14
22. Constructing and Interpreting Bar Graphs
1 2 3 4 5 6 7 8 9 10 11 12 13 14
Back to chapter
ADVERTISEMENT
About Contact Privacy Terms
Philoid · 2026
  • Home
  • Search
  • Browse
  • Quiz
  • Saved